In the super-fast-paced digital world of today, social media has already transformed into an arena for engagement and community building wherein brands and individuals develop relationships.
Nevertheless, with all the buzz going around, how do you ascertain if your ongoing efforts have been bearing fruit? Whether one is an expert social media manager coping with complex campaigns or a small business owner just getting to know the online world, one thing is very obvious: clear understanding of the metrics that matter is extremely critical to attaining sustainable success.
This is your step-by-step guide to social media metrics. This guide will unveil KPIs that serve as actionable insight toward your audience, content, and overall strategy. You’ll be able to read these metrics, differentiate the trends, and know what story the data is saying.
The most imperative aspect is that we will forward the information and tools to assist you in converting the raw data into data-based insights, which could then ramp up your social strategy for actual meaningful engagement ultimately connected to business success.
You can click here to learn more about social media management.
Why Metrics Matter?

Before we dive into the nitty-gritty of specific metrics, let’s take a moment to understand why they matter. In today’s digital age, where 94.2% of internet users have social media identities, social media metrics serve as your compass, guiding you toward your goals in this vast ocean of online interaction.
They provide invaluable insights into the performance of your content, audience engagement, and overall strategy effectiveness. According to The 2023 State of Social Media report, over half of business leaders say that social media data and insights currently inform their company’s business strategy.
Without metrics, you’re essentially sailing blind, with no way to course-correct, tie your efforts to business goals, or prove your success. However, armed with the right data, you can confidently steer your ship, making informed decisions that drive real results and optimize your campaigns as needed.”
The Core Metrics

When it comes to social media analytics, there’s no shortage of numbers to crunch. But not all metrics are created equal. Here are some of the core metrics you should focus on:
1. Engagement Rate
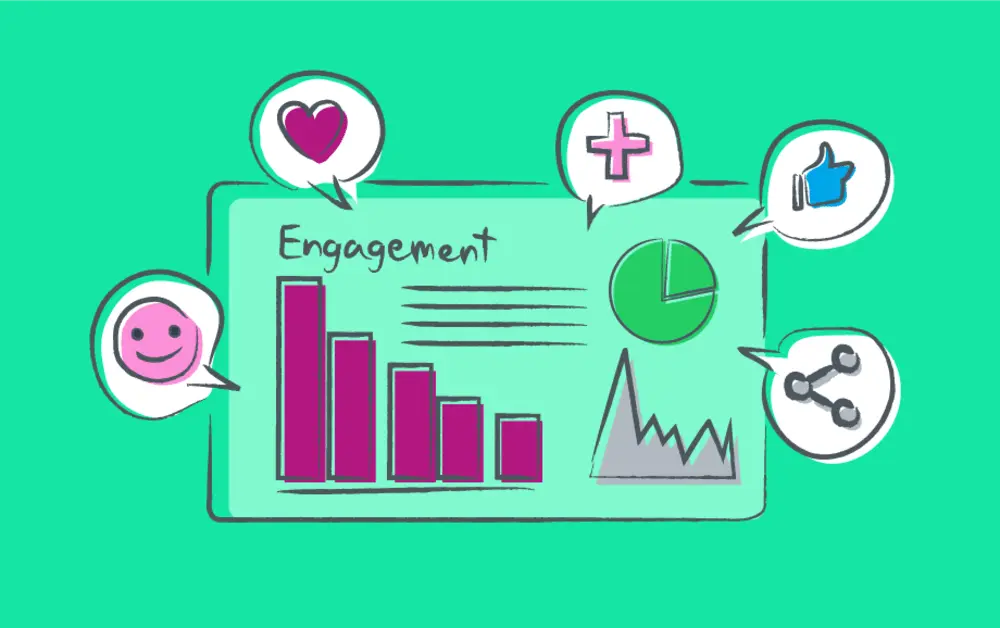
Engagement rate is the holy grail of social media metrics. It measures the level of interaction your content receives relative to your total audience. Likes, comments, shares, and clicks all contribute to engagement. A high engagement rate indicates that your content is resonating with your audience and sparking conversation.
2. Reach
Reach measures the total number of unique users who have seen your content. It’s a key indicator of your content’s visibility and potential impact. Increasing your reach means expanding your audience and reaching new potential followers or customers.
3. Click-Through Rate (CTR)
CTR measures the percentage of users who clicked on a link in your post, relative to the total number of users who saw the post. It’s a crucial metric for evaluating the effectiveness of your call-to-action (CTA) and driving traffic to your website or landing page.
4. Conversion Rate
Conversion rate tracks the percentage of users who completed a desired action, such as making a purchase or signing up for a newsletter, after clicking on your content. It’s the ultimate measure of your social media ROI and indicates how well your content is driving real-world results.
Interpreting the Data

Now that you know the key metrics to track, let’s talk about how to interpret the data. Raw numbers only tell part of the story; it’s the insights behind the numbers that truly matter.
1. Identify Trends
Look for patterns and trends in your data. Are certain types of content consistently performing better than others? Are there specific times of day or days of the week when your audience is most active? By identifying trends, you can capitalize on what’s working and refine what’s not.
2. Audience Insights
Dig deeper into your audience demographics and behavior. Who are your followers? What are their interests, preferences, and pain points? Understanding your audience on a deeper level allows you to tailor your content to their needs and preferences.
3. A/B Testing
Experiment with different variables, such as messaging, visuals, and posting times, to see what resonates best with your audience. A/B testing allows you to make data-driven decisions and optimize your content for maximum impact.
Putting Insights into Action

Armed with data-driven insights, it’s time to put your learnings into action and optimize your social media strategy for success.
1. Content Optimization
Use insights from your engagement metrics to fine-tune your content strategy. Double down on the types of content that drive the highest levels of engagement, whether it’s eye-catching visuals, compelling storytelling, or interactive polls.
2. Audience Targeting
Tailor your content to resonate with your target audience. Use audience insights to craft messaging that speaks directly to their needs and interests. Experiment with different targeting options, such as age, gender, location, and interests, to reach the right audience segments.
3. Performance Tracking
Continuously monitor and track the performance of your social media efforts. Set clear goals and benchmarks, and regularly evaluate your progress against them. Use data to iterate and refine your strategy over time, ensuring that you’re always moving closer to your objectives.
Leveraging Platform-Specific Insights
While the core metrics discussed above provide a solid foundation for evaluating social media performance, it’s also essential to dive into platform-specific insights. Each social media platform has its own set of analytics tools and metrics, offering unique insights into audience behavior and content performance.
1. Instagram Insights
Instagram Insights offers valuable data regarding audience demographics, content reach, and engagement. Key metrics to pay attention to include:
- Follower demographics: Gain insights into your audience’s age, gender, and location to refine your content strategy. Globally, as of January 2024, Instagram’s user base is nearly evenly split between males (50.6%) and females (49.4%). In the U.S., 78% of people aged 18-29 use Instagram.
- Content performance: Evaluate metrics such as likes, comments, and shares to pinpoint successful posts and topics. Instagram Reels, for example, get an average of 15,000 views and 805 likes, which is significantly more engagement than regular posts.
- Stories analytics: Monitor metrics like impressions, exits, and taps forward to assess the impact of your Instagram Stories.
2. Facebook Analytics
Facebook Analytics provides insights into your Page’s performance and audience behavior through key metrics. Here’s how to understand them with real figures:
- Page Likes and Follows: Track changes in Page likes and follows to evaluate overall audience growth.
- Post Reach: Reach is the number of unique users who have seen your content. The average organic reach for a Facebook post was about 2.6% to 6.4% of the page’s likes in 2024. To calculate reach, access your business’s Facebook account, go to Insights, and export data. Then, select post data for the data type and a relevant date range.
- Post Engagement: Engagement is any activity a Facebook user takes on your content, including likes, comments, shares, and clicks. The average engagement rate for an organic Facebook post is 3.91%. However, the median engagement rate is around 0.063%. An engagement rate above 1% is generally considered good.
- Audience Demographics: Delve into audience demographics, interests, and behaviors to shape your content strategy.
It’s worth noting that Instagram generally sees higher engagement rates than Facebook. In 2024, Instagram’s engagement rate by reach averaged 3.50%, while Facebook’s was around 1.20%. Photo and status posts tend to have the highest engagement on Facebook.
The Role of Social Listening
In addition to tracking metrics and analyzing data, social listening plays a crucial role in effective social media management. Social listening involves monitoring online conversations and mentions of your brand, competitors, industry keywords, and relevant topics across social media channels.
1. Brand Reputation Management
Social listening allows you to stay informed about what people are saying about your brand online. By monitoring mentions and sentiment, you can quickly identify and address any potential issues or negative feedback, helping to protect and manage your brand’s reputation.
2. Audience Insights
Social listening provides valuable insights into your audience’s interests, preferences, and pain points. By monitoring conversations related to your industry or niche, you can uncover valuable insights that inform your content strategy and messaging.
3. Competitive Analysis
Social listening also lets you keep tabs on competitors and industry trends. By monitoring competitor mentions and industry conversations, you can identify emerging trends, benchmark your performance against competitors, and uncover new growth opportunities.
Conclusion
In the fast-paced world of social media, data is your most valuable asset. By understanding the metrics that matter and leveraging data-driven insights, you can optimize your social media strategy for success. Remember, it’s not just about the numbers; it’s about the insights behind them. So dive into your analytics, uncover the trends, and let the data guide you toward social media mastery.
Read More: 7+ Best Free HTML5 Admin Dashboard Templates
Contact US | ThimPress:
Website: https://thimpress.com/
Fanpage: https://www.facebook.com/ThimPress
YouTube: https://www.youtube.com/c/ThimPressDesign
Twitter (X): https://x.com/thimpress_com


