Choosing a dashboard platform is hard when every vendor claims to be the easiest and the most powerful. This business intelligence tools list compares the most widely used products side by side, so you can match one to your data, your budget, and your team’s skills. It is written for business owners, analysts, and site managers who need a clear answer, not a sales pitch.
Eduma – Education WordPress Theme
We provide an amazing WordPress theme with fast and responsive designs. Let’s find out!
What business intelligence tools do
A business intelligence tool is software that connects to your data sources, cleans and models the data, and turns it into reports and dashboards that people can read without writing code. In short, it helps you answer questions such as “Which product sold best last quarter?” in minutes instead of days.
Core features to expect
Most modern business intelligence software shares the same building blocks. Knowing them makes it easier to compare products fairly.
- Data connectors: Links to databases, spreadsheets, cloud apps, and files such as CSV and Excel.
- Data preparation: Tools to clean, join, and reshape data before you chart it.
- Dashboards and reports: Interactive pages with filters, drill-downs, and scheduled delivery.
- Sharing and permissions: Controls over who can view or edit each report.
- Alerts and automation: Notices when a metric moves past a limit you set.
BI tools vs spreadsheets
Spreadsheets work well for small, one-off analysis. They struggle when several people need the same numbers, when data refreshes daily, or when files grow too large to open quickly. A BI platform keeps one trusted version of the data and refreshes it on a schedule, which removes the “which file is the latest?” problem.
How we chose the tools
Each product on this list was compared against the same five criteria, using official product documentation and public feature pages. This keeps the comparison fair and easy to repeat.
- Ease of use: How quickly a non-technical person can build a first dashboard.
- Data connectivity: Range of supported sources and how well live connections work.
- Visualization quality: Chart variety, formatting control, and interactivity.
- Scalability and governance: Handling of large data, user roles, and security.
- Cost model: Free tiers, per-user pricing, and open-source options.
Vendors change plans often. Always confirm current pricing and limits on the vendor’s own website before you commit. The details below reflect product positioning as of late 2026.
9+ business intelligence tools list
Below are nine well-known options, grouped from the most popular platforms to lighter and open-source choices. Each entry covers what the tool does well, where it falls short, and who should consider it.
1. Microsoft Power BI
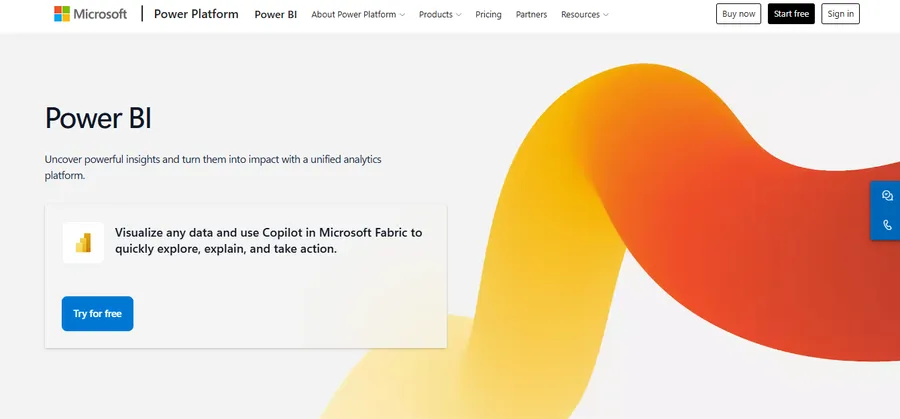
Power BI is one of the most widely adopted BI software tools, mainly because it fits neatly into the Microsoft ecosystem. Power BI Desktop is free to download on Windows, and you pay when you want to publish and share reports in the cloud service.
- Strengths: Deep Excel, Azure, and Microsoft Fabric integration. Power Query handles data cleaning, and DAX handles calculations.
- Limits: DAX has a learning curve. Desktop authoring is Windows-only.
- Best for: Teams already using Microsoft 365 and Azure.
2. Tableau
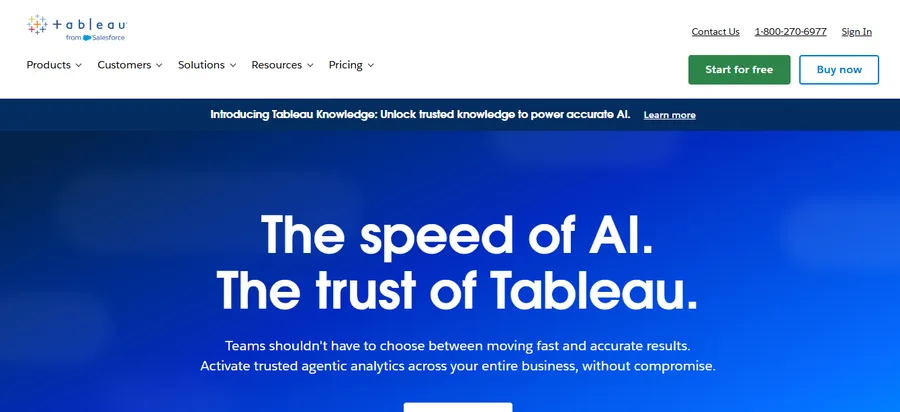
Tableau, owned by Salesforce, is known for fast visual exploration. Drag a field onto the canvas and the chart updates right away, which makes it a favorite among analysts who want to explore data freely.
- Strengths: Excellent chart flexibility, strong community, and Tableau Prep for data preparation.
- Limits: Costs can rise as you add users and roles. Governance setup takes planning.
- Best for: Analyst teams that value polished, interactive visuals.
3. Looker and Looker Studio

Looker is part of Google Cloud and is built around LookML, a modeling layer where you define metrics once so everyone reports the same numbers. Looker Studio is a separate, free tool that connects easily to Google Analytics 4, Google Sheets, BigQuery, and Google Ads.
- Strengths: Central metric definitions in Looker. Quick, free reporting in Looker Studio.
- Limits: Looker needs developer skills for LookML. Looker Studio is lighter on advanced modeling.
- Best for: Marketing teams (Looker Studio) and data-mature companies on Google Cloud (Looker).
4. Qlik Sense
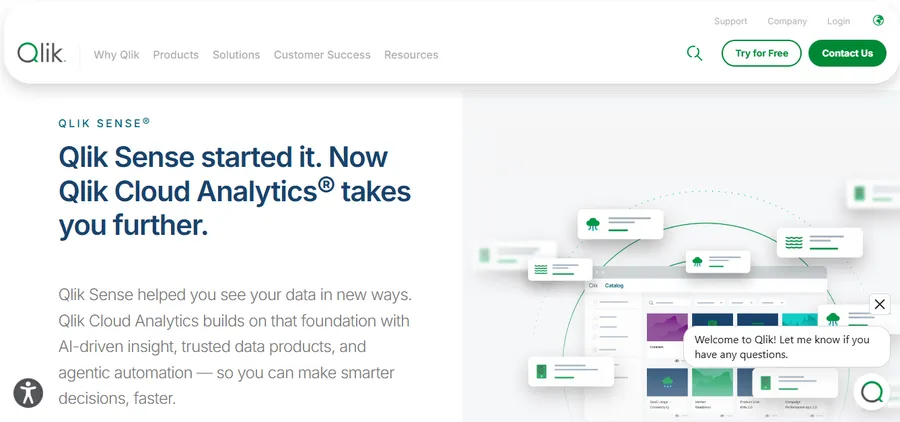
Qlik Sense uses an associative engine. When you click a value, it shows related data and also highlights what is not related, which can reveal gaps that filter-based tools hide.
- Strengths: Strong data exploration, good for complex data relationships, cloud and on-premises options.
- Limits: Interface and licensing can feel complex for beginners.
- Best for: Mid-size and large organizations with varied data sources.
5. Zoho Analytics
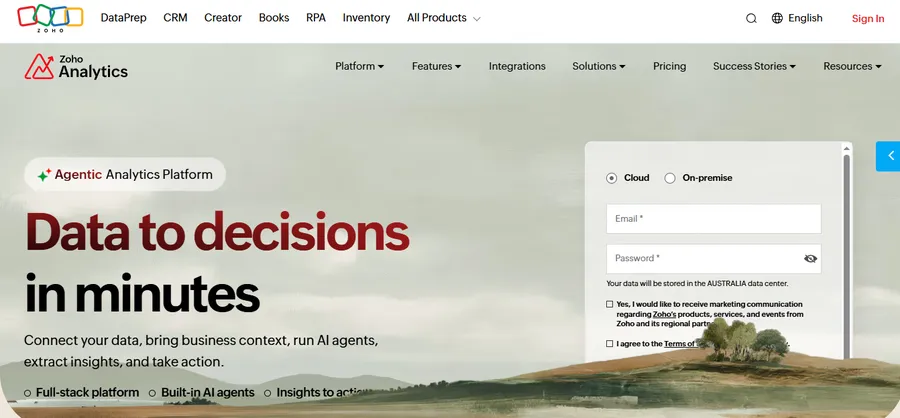
Zoho Analytics is a practical online business intelligence tool for small and mid-sized businesses. It connects to Zoho CRM, Zoho Books, and many third-party apps, and includes an AI assistant for natural-language questions.
- Strengths: Affordable entry, simple setup, and many ready-made reports.
- Limits: Fewer advanced customization options than Tableau or Power BI.
- Best for: Small businesses already using Zoho apps.
6. Metabase
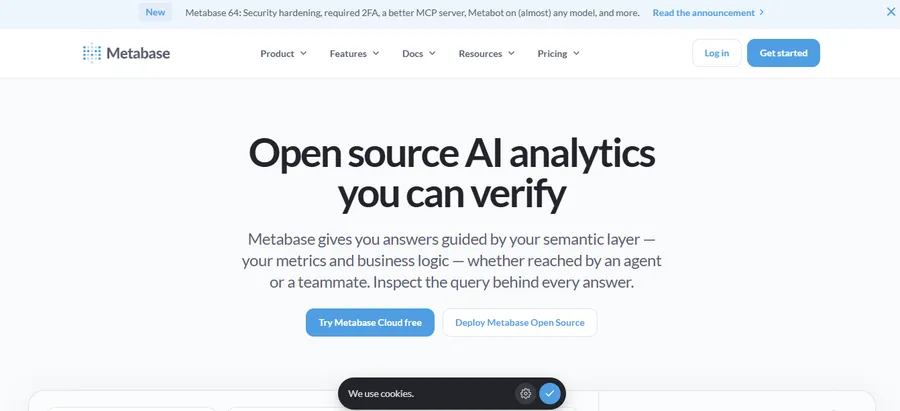
Metabase is an open-source tool you can host yourself or use as a cloud service. Its visual query builder lets non-technical staff ask questions without SQL, while analysts can still write SQL when needed.
- Strengths: Very easy to start, friendly interface, and embedding options.
- Limits: Less advanced modeling and fewer chart types than larger platforms.
- Best for: Startups and teams that want quick self-service reporting.
7. Apache Superset
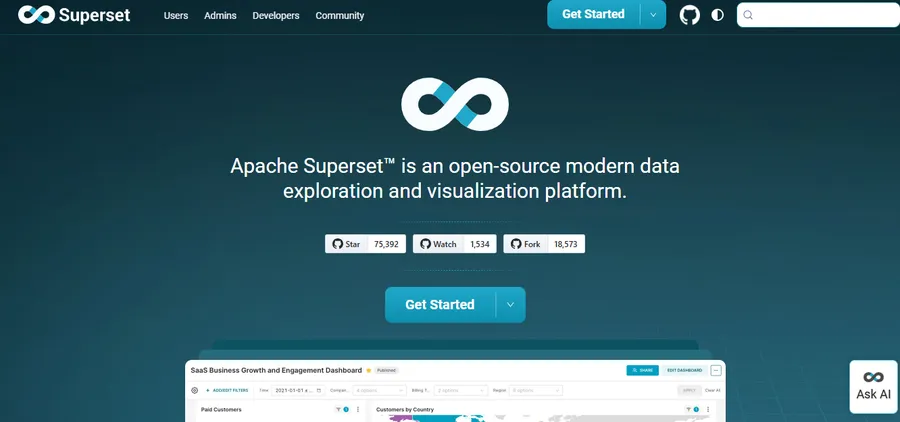
Apache Superset is a free, open-source platform maintained under the Apache Software Foundation. It offers SQL Lab for writing queries and a wide range of chart types, and it scales well when set up correctly.
- Strengths: No license cost, flexible, and strong chart library.
- Limits: Needs engineering time for installation, security, and upkeep.
- Best for: Technical teams that want full control and have DevOps support.
8. Domo
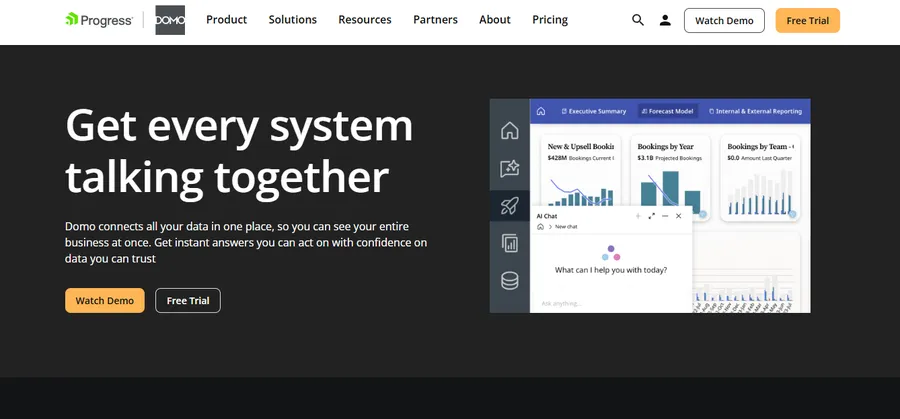
Domo is a cloud platform that combines data integration, dashboards, and apps in one place. It offers a large library of connectors, which suits companies that pull data from many SaaS tools.
- Strengths: Many connectors, mobile-friendly dashboards, and collaboration features.
- Limits: Pricing is typically quote-based, and costs can be high for small teams.
- Best for: Larger organizations that want an all-in-one cloud platform.
9. Sisense
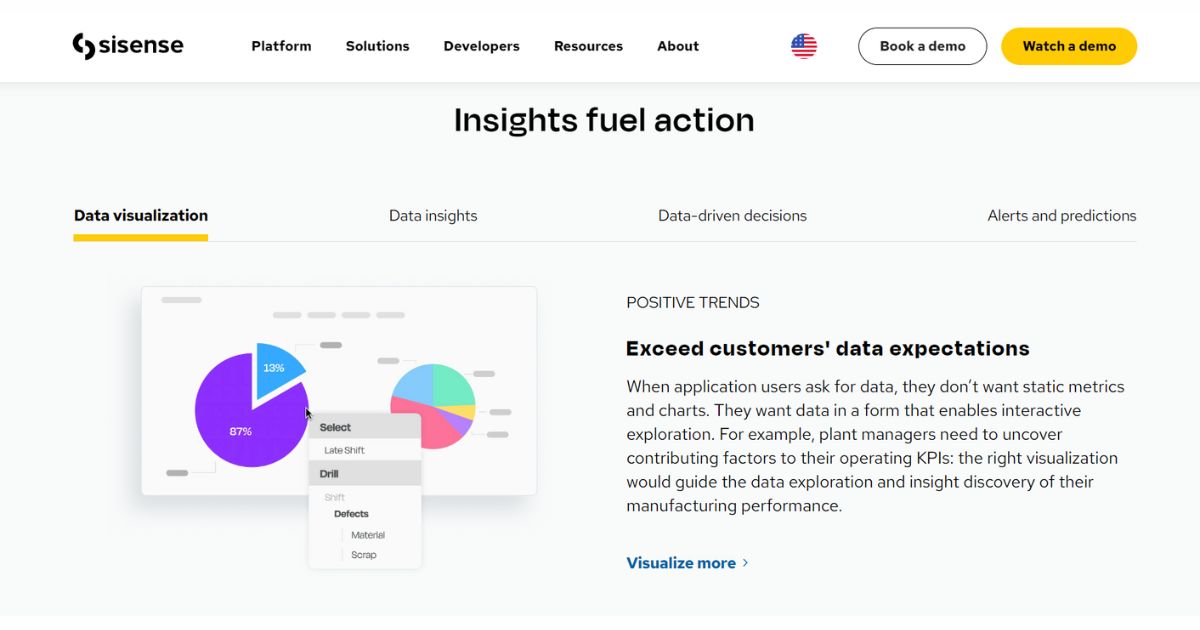
Sisense focuses on embedded analytics, meaning you place dashboards inside your own product or portal. Software companies often choose it to give customers built-in reporting.
- Strengths: Strong embedding and API options.
- Limits: Better suited to teams with technical resources.
- Best for: SaaS companies adding analytics to their own app.
BI tools comparison table
This table summarizes the key differences between the top BI tools above. Use it as a quick filter, then test two or three finalists with your own data.
| Tool | Best for | Standout feature | Cost model | Skill level |
|---|---|---|---|---|
| Power BI | Microsoft-based teams | Excel and Azure integration | Free desktop, paid sharing | Beginner to advanced |
| Tableau | Visual analysis | Drag-and-drop exploration | Per-user subscription | Intermediate |
| Looker | Governed metrics | LookML modeling layer | Quote-based | Advanced |
| Looker Studio | Marketing reports | Free Google connectors | Free, with paid options | Beginner |
| Qlik Sense | Complex data links | Associative engine | Subscription | Intermediate |
| Zoho Analytics | Small business | Zoho app integration | Low-cost plans | Beginner |
| Metabase | Quick self-service | Visual query builder | Open source or cloud plan | Beginner |
| Apache Superset | Technical teams | SQL Lab and flexibility | Free, self-hosted | Advanced |
| Domo | Enterprise cloud | Large connector library | Quote-based | Intermediate |
| Sisense | Embedded analytics | Embedding and APIs | Quote-based | Advanced |
What to look for in visualization tools
Business intelligence visualization tools turn rows of numbers into charts that people can read in seconds. A tool can have excellent data handling and still produce dashboards that nobody uses, so visuals deserve their own check.
Chart variety and control
Look for the basics first: bar, line, pie, table, map, and scatter charts. Then check for control over colors, labels, and number formats. Tableau and Power BI lead here, while Looker Studio and Metabase cover common needs with less setup.
Interactivity
Good dashboards let users filter by date, region, or product and click a chart to drill into detail. Test this on a phone and a laptop. A dashboard that looks fine on a wide screen but breaks on mobile will frustrate readers.
Performance on large data
Slow dashboards are the fastest way to lose trust. Check whether the tool queries your database live or imports a copy. Imported data loads faster but needs scheduled refreshes. Live queries stay current but depend on your database speed.
How to choose an online business intelligence tool
An online business intelligence tool runs in the browser or the vendor’s cloud, so you avoid installing servers and your team can access reports from anywhere. The right choice depends on three practical questions.
Match the tool to your team’s skills
If your team works mostly in spreadsheets, start with Power BI, Zoho Analytics, Looker Studio, or Metabase. If you have data engineers who write SQL daily, Looker, Superset, or Sisense become realistic options.
Check your data sources first
List every system that holds data you need, such as your CRM, accounting software, ad platforms, and databases. Then check each tool’s connector list. A missing connector often means extra cost for a third-party sync tool.
Plan for cost and governance
Per-user pricing looks cheap with five users and expensive with fifty. Ask how viewers are priced compared with creators, since many platforms charge less for read-only access. Also decide early who can edit dashboards and who can only view them, so reports stay consistent.
A simple way to decide:
- Write down your top five business questions.
- List your data sources and who will build reports.
- Shortlist three tools from the comparison table.
- Connect each one to the same sample dataset.
- Compare setup time, dashboard quality, and total cost.
Using BI dashboards on a WordPress site
Many BI tools let you share dashboards publicly or privately, and you can place them on a WordPress page. Looker Studio and Metabase support embed links, and Power BI offers publish and embed options with their own access rules. In the block editor, you can paste the embed code into a Custom HTML block or use an iframe-friendly embed block.
Two cautions apply. First, never embed a public link for private data, because anyone with the link can view it. Second, check page speed after embedding, since iframes can add to load time and affect Core Web Vitals such as LCP and CLS. Lazy loading the iframe helps.
If you are building analytics skills for a team or selling data courses, a learning platform can help. Eduma, the education WordPress theme from ThimPress, pairs with the LearnPress LMS plugin so you can structure a Power BI or Tableau course into lessons, quizzes, and certificates. This is useful only if you plan to teach or train others. If you just need dashboards for your own business, you can skip it.
Common mistakes when picking BI software
Most failed BI projects fail because of planning, not technology. These mistakes are easy to avoid once you know them.
- Choosing by brand alone: The most famous tool is not always the best fit for your data or budget.
- Ignoring data quality: A beautiful dashboard built on messy data still gives wrong answers. Clean the source first.
- Building too many dashboards: Start with five to ten key metrics. More pages usually mean less use.
- Skipping training: Even easy tools need a short onboarding so people trust and use the reports.
- Forgetting security: Set roles and row-level access before sharing sensitive data.
FAQs
What is the easiest BI tool for beginners?
Looker Studio, Zoho Analytics, and Metabase are among the easiest to start with. Looker Studio is free and connects directly to Google Sheets and GA4, so you can build a first report in under an hour. Metabase adds a visual query builder that avoids SQL.
Are there free BI tools?
Yes. Power BI Desktop, Looker Studio, Metabase’s open-source edition, and Apache Superset are free to use at the basic level. Free often has limits, such as restricted sharing or the need to host the software yourself, so check what is included.
What is the difference between BI and data analytics?
BI mainly describes what has already happened, using dashboards and reports on historical data. Data analytics is broader and can include predicting future results and testing ideas with statistical or machine learning methods. Most BI platforms now include some predictive features, so the line is getting thinner.
Do I need a data warehouse to use a BI tool?
No, but it helps as your data grows. Small teams can connect BI tools directly to spreadsheets and apps. Once data comes from many systems, a warehouse such as BigQuery, Snowflake, or Amazon Redshift keeps reports faster and more consistent.
Conclusion
The right tool from this business intelligence tools list depends on your team, not on the longest feature sheet. Power BI suits Microsoft users, Tableau suits visual analysts, Looker fits governed Google Cloud setups, and Zoho Analytics or Metabase work well for smaller teams. Open-source choices like Superset give control to technical teams that can maintain them.
Start small. Pick two or three finalists, test them on the same sample data, and judge them on setup time, clarity of dashboards, and total cost. Once a tool earns your team’s trust, expand step by step, and revisit your choice yearly as products and pricing change.
Read more: Define SaaS: Meaning, Examples, and Guide
Contact US | ThimPress:
Website: https://thimpress.com/
Fanpage: https://www.facebook.com/ThimPress
YouTube: https://www.youtube.com/c/ThimPressDesign
Twitter (X): https://x.com/thimpress_com